cuốn sách thử nghiệm dựa «Spiral
Dynamics: Mastering Values, Leadership,
and Change» (ISBN-13: 978-1405133562)
Nhà tài trợ

The Tale of the Tall Oak

Once upon a time, there was a tiny oak tree sapling named Peety. Peety dreamed of growing up into a mighty oak tree. 


Each year, Peety grew a little bit taller. He stretched his branches toward the sun and felt his trunk thicken as he grew. 


Over many years, Peety grew from a sapling into a young tree and finally into a tall, mature oak! He was so tall that he could see over the whole forest.


Peety noticed that the other tall oak trees had thick trunks, too. His friend Paul reached high into the sky just like Peety. Paul's trunk was thick and sturdy at the base. 


The small saplings that were sprouting had skinny little trunks. But Peety knew that would change over time as they grew taller.


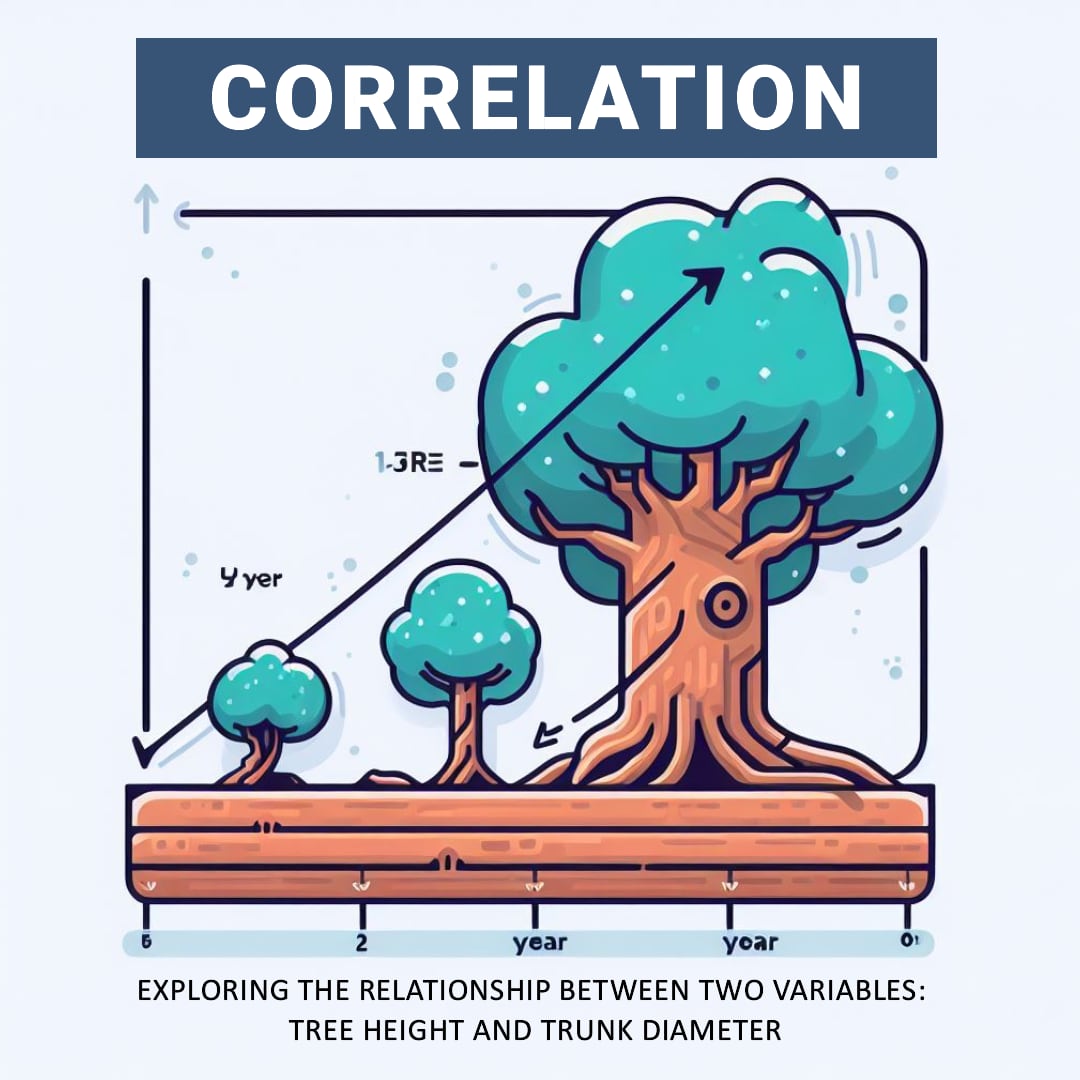
Peety realized that, just like him, the taller an oak tree was, the thicker its trunk became. 


So even though the forest was filled with all different sizes of oak trees, Peety noticed a pattern - a correlation between tree height and trunk width. The tall trees always had thicker trunks, while the small saplings had skinny trunks. This was how pine trees grew strong enough to reach great heights! 


If you record how a tree grows - its height and trunk thickness - and plot it on a picture or graph, then the correlation is when these two things change together. That is, if you see that one is increasing, the other is also increasing, and vice versa.


The SDTEST® gives clues to someone's motivational values. However, additional polls can provide more pieces of the puzzle.


Imagine also giving a "Fears" poll. It asks people to rate different fears from 0 (not scary) to 5 (very scary). 


Now imagine 100 people who took both tests. You could match up each person's SDTEST® colors with their rated fears.


If people high in Blue values feared uncertainty more, that insight ties values to perceptions. Blue people may resist change more.


Or if Orange achievers feared failure most, that reveals their drive. They may overwork to avoid mistakes.


Comparing tests gives an expanded picture of values in action. More puzzle pieces make the whole image more apparent!


Multiple tests can work together, like colors blending on a palette. Other polls reveal what engages your values, like how your hobbies show what activities you enjoy most. Combined, they paint a richer picture of what motivates our thoughts and deeds.


Below you can read an abridged version of the results of our VUCA poll “Fears“. The full results of our VUCA poll “Fears“ are available for free in the FAQ section after login or registration.


Sợ hãi

Quốc gia
ngôn ngữ
-
Mail
Tái tính
Có một sự tương quan ý nghĩa thống kê
Phân phối bình thường, bởi William Sealy Gosset (sinh viên) r = 3.51
Phân phối không bình thường, bởi Spearman r = 0.14
Câu hỏi thăm dò ý kiến
Tất cả các câu hỏi
Tất cả các câu hỏi
Nỗi sợ lớn nhất của tôi là
Phân bổ
Tương quan tích cực,% Tương quan tiêu cực,%
Bình thường
-14.5
Answer 1
-8.8
Answer 2
-1.1
Answer 3
-8.7
Answer 4
-16.3
Answer 5
-2.8
Answer 6
-4.9
Answer 7
-12.9
Answer 8
-17.4
Answer 9
-12.7
Answer 10
-11.8
Answer 11
-14.7
Answer 12
-15.6
Answer 13
-11.1
Answer 14
-11.2
Answer 15
-6.7
Answer 16
Bình thường
7.6
Answer 3
0.6
Answer 4
8
Answer 6
5.8
Answer 7
1.2
Answer 8
2.7
Answer 11
3.1
Answer 12
1.7
Answer 13
1.4
Answer 15
2.3
Answer 16
-1.6
Answer 1
-0.3
Answer 2
-1
Answer 5
-5.6
Answer 9
-2
Answer 10
-0.5
Answer 14
Bình thường
3.8
Answer 1
4.4
Answer 2
5.1
Answer 3
3.6
Answer 4
0.3
Answer 5
1.8
Answer 6
4.1
Answer 7
3.3
Answer 8
3.6
Answer 10
2.1
Answer 11
2.9
Answer 12
4.6
Answer 13
7.6
Answer 16
-1
Answer 9
-0.8
Answer 14
-1
Answer 15
Bình thường
8.4
Answer 1
6.4
Answer 2
1
Answer 4
6.4
Answer 5
1.2
Answer 8
7.3
Answer 9
2.1
Answer 10
3.1
Answer 12
2.1
Answer 13
1.5
Answer 15
-5.6
Answer 3
-1.2
Answer 6
-3.2
Answer 7
-0.9
Answer 14
-5
Answer 16
Bình thường
1.2
Answer 5
0.8
Answer 9
0.4
Answer 11
1.1
Answer 14
-1.3
Answer 1
-3.6
Answer 2
-3.8
Answer 3
-0.8
Answer 4
-5.7
Answer 6
-5.6
Answer 7
-2.7
Answer 8
-1.9
Answer 10
-3.4
Answer 12
-4.2
Answer 13
-3.8
Answer 15
-3.4
Answer 16
Không
bình thường
2.5
Answer 1
2.3
Answer 4
11.7
Answer 5
3.7
Answer 7
7.2
Answer 8
15.2
Answer 9
6.6
Answer 10
4.5
Answer 11
9.7
Answer 12
10
Answer 13
10.3
Answer 14
12.6
Answer 15
1.7
Answer 16
-2.2
Answer 3
-0.2
Answer 6
Không
bình thường
4.6
Answer 1
2.5
Answer 2
0.2
Answer 3
4.2
Answer 4
1.4
Answer 5
0.5
Answer 6
1.9
Answer 7
7.1
Answer 8
6.3
Answer 9
8.1
Answer 10
5.7
Answer 11
3.2
Answer 12
6.2
Answer 13
7.2
Answer 14
5.8
Answer 15
5.9
Answer 16


Xuất khẩu sang MS Excel
Chức năng này sẽ có sẵn trong các cuộc thăm dò VUCA của riêng bạn
Được

2023.11.22
Valerii Kosenko
Chủ sở hữu sản phẩm SaaS PET Project Sdtest®

Valerii đủ điều kiện là một nhà tâm lý học sư phạm xã hội vào năm 1993 và kể từ đó đã áp dụng kiến ​​thức của mình trong quản lý dự án.
Valerii có bằng thạc sĩ và trình độ quản lý chương trình và dự án vào năm 2013. Trong chương trình thạc sĩ của mình, anh ta đã quen thuộc với Lộ trình dự án (GPM Deutsche Gesellschaft Für Projektman Quản lý e. V.) và động lực xoắn ốc.
Valerii đã thực hiện các bài kiểm tra động lực xoắn ốc khác nhau và sử dụng kiến ​​thức và kinh nghiệm của mình để điều chỉnh phiên bản SDTest hiện tại.
Valerii là tác giả khám phá sự không chắc chắn của V.U.C.A. Khái niệm sử dụng động lực xoắn ốc và thống kê toán học trong tâm lý học, hơn 20 cuộc thăm dò quốc tế.
Bài này có 0 Bình luận
Trả lời
Hủy trả lời
Để lại nhận xét của bạn
×
Bạn thấy lỗi
Kiến nghị VERSION ĐÚNG BẠN
Nhập e-mail của bạn như mong muốn
Gửi
hủy bỏ
Redirect to your region's domain sdtest.us ?
YES
NO
Bot
sdtest
1
Chào bạn! Hãy để tôi hỏi bạn, bạn đã quen thuộc với động lực xoắn ốc?