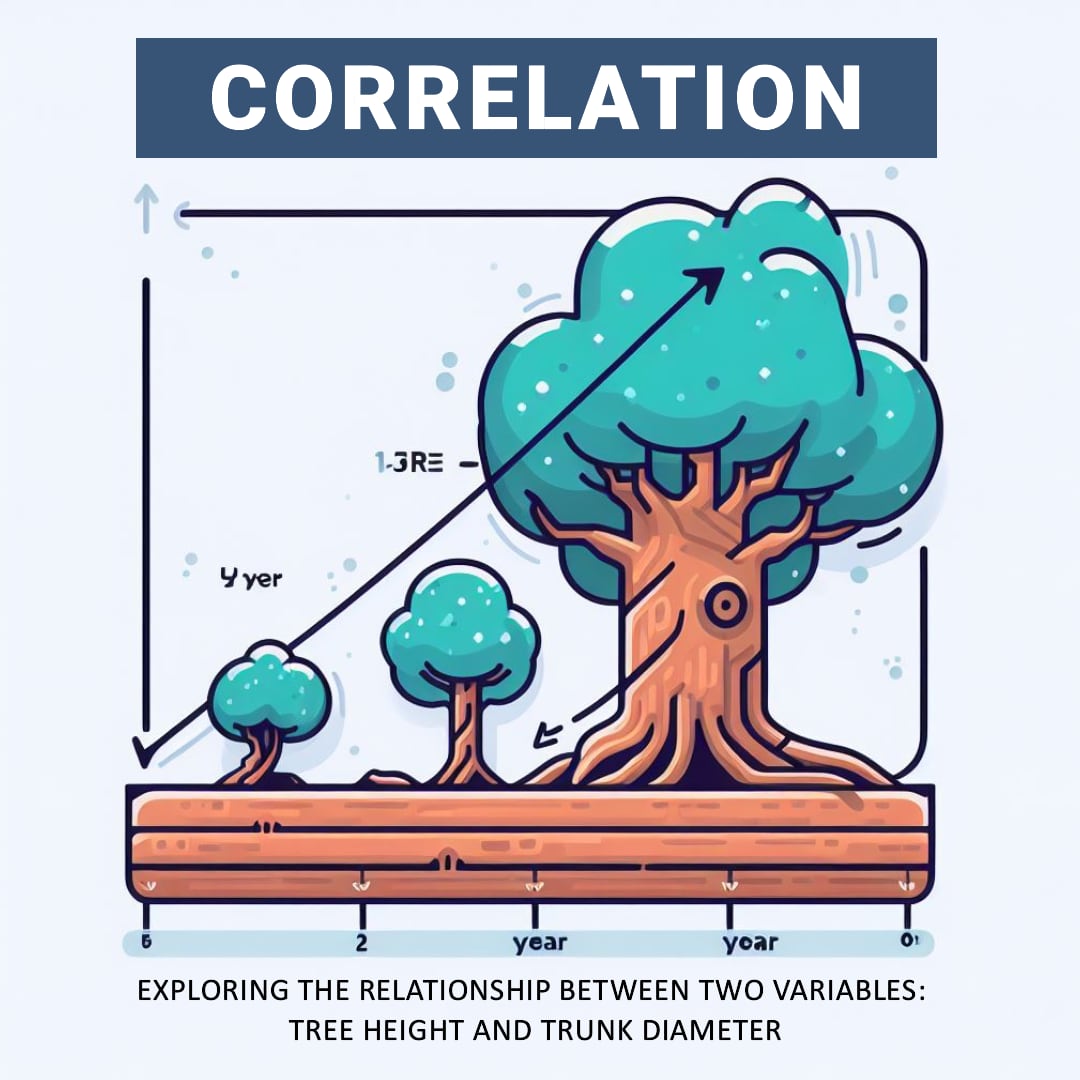
The Tale of the Tall Oak

Once upon a time, there was a tiny oak tree sapling named Peety. Peety dreamed of growing up into a mighty oak tree. 


Each year, Peety grew a little bit taller. He stretched his branches toward the sun and felt his trunk thicken as he grew. 


Over many years, Peety grew from a sapling into a young tree and finally into a tall, mature oak! He was so tall that he could see over the whole forest.


Peety noticed that the other tall oak trees had thick trunks, too. His friend Paul reached high into the sky just like Peety. Paul's trunk was thick and sturdy at the base. 


The small saplings that were sprouting had skinny little trunks. But Peety knew that would change over time as they grew taller.


Peety realized that, just like him, the taller an oak tree was, the thicker its trunk became. 


So even though the forest was filled with all different sizes of oak trees, Peety noticed a pattern - a correlation between tree height and trunk width. The tall trees always had thicker trunks, while the small saplings had skinny trunks. This was how pine trees grew strong enough to reach great heights! 


If you record how a tree grows - its height and trunk thickness - and plot it on a picture or graph, then the correlation is when these two things change together. That is, if you see that one is increasing, the other is also increasing, and vice versa.


The SDTEST® gives clues to someone's motivational values. However, additional polls can provide more pieces of the puzzle.


Imagine also giving a "Fears" poll. It asks people to rate different fears from 0 (not scary) to 5 (very scary). 


Now imagine 100 people who took both tests. You could match up each person's SDTEST® colors with their rated fears.


If people high in Blue values feared uncertainty more, that insight ties values to perceptions. Blue people may resist change more.


Or if Orange achievers feared failure most, that reveals their drive. They may overwork to avoid mistakes.


Comparing tests gives an expanded picture of values in action. More puzzle pieces make the whole image more apparent!


Multiple tests can work together, like colors blending on a palette. Other polls reveal what engages your values, like how your hobbies show what activities you enjoy most. Combined, they paint a richer picture of what motivates our thoughts and deeds.


Below you can read an abridged version of the results of our VUCA poll “Fears“. The full results of our VUCA poll “Fears“ are available for free in the FAQ section after login or registration.


Baimė

Šalis
kalba
-
Mail
Perskaičiuoti
Yra statistiškai reikšmingas ryšys
Normalus platinimas, pateikė William Sealy Gosset (studentas) r = 3.3
Ne normalus pasiskirstymas, autorius Spearman r = 0.13
Apklausos klausimai
Visi klausimai
Visi klausimai
Mano didžiausia baimė yra
Paskirstymas
Teigiama koreliacija,% Neigiama koreliacija,%
Normalus
-15.5
Answer 1
-9.4
Answer 2
-2
Answer 3
-9.9
Answer 4
-17.6
Answer 5
-3.2
Answer 6
-5.2
Answer 7
-13.7
Answer 8
-18.2
Answer 9
-13.1
Answer 10
-12
Answer 11
-15.2
Answer 12
-16
Answer 13
-11.7
Answer 14
-11.8
Answer 15
-7.1
Answer 16
Normalus
1.3
Answer 2
7.9
Answer 3
2.1
Answer 4
8.3
Answer 6
6.4
Answer 7
1.4
Answer 8
3.1
Answer 11
3
Answer 12
1.8
Answer 13
0.9
Answer 14
2.3
Answer 15
2.9
Answer 16
-1.2
Answer 1
-2
Answer 5
-5.2
Answer 9
-1.3
Answer 10
Normalus
3
Answer 1
4.4
Answer 2
4.7
Answer 3
3
Answer 4
1.9
Answer 6
4.7
Answer 7
3.5
Answer 8
3.4
Answer 10
2
Answer 11
2.5
Answer 12
4.2
Answer 13
6.5
Answer 16
-0.1
Answer 5
-1.3
Answer 9
-0.1
Answer 14
-1.6
Answer 15
Normalus
9.1
Answer 1
6.4
Answer 2
1.4
Answer 4
7.3
Answer 5
1.4
Answer 8
6.9
Answer 9
2.4
Answer 10
0.8
Answer 11
3.5
Answer 12
2.6
Answer 13
1.7
Answer 15
-4.7
Answer 3
-0.9
Answer 6
-2.5
Answer 7
-0.9
Answer 14
-4
Answer 16
Normalus
1.4
Answer 5
0.9
Answer 9
-1.6
Answer 1
-4.5
Answer 2
-4.1
Answer 3
-1.9
Answer 4
-6.2
Answer 6
-6.8
Answer 7
-3.2
Answer 8
-2
Answer 10
-0.9
Answer 11
-3.5
Answer 12
-4.4
Answer 13
-4.2
Answer 15
-3.8
Answer 16
Ne
normalu
3.2
Answer 1
3.5
Answer 4
12.8
Answer 5
0.8
Answer 6
3.8
Answer 7
8.5
Answer 8
16.8
Answer 9
7.6
Answer 10
5.3
Answer 11
10.4
Answer 12
10.5
Answer 13
10.2
Answer 14
13.7
Answer 15
2.7
Answer 16
-1.2
Answer 3
Ne
normalu
5.7
Answer 1
2.3
Answer 2
4.4
Answer 4
3.1
Answer 5
1.3
Answer 7
7
Answer 8
6.7
Answer 9
7.9
Answer 10
5.8
Answer 11
3.9
Answer 12
6.5
Answer 13
7.2
Answer 14
5.6
Answer 15
5.9
Answer 16
-0.3
Answer 3


Eksportas į MS Excel
Ši funkcija bus prieinama jūsų VUCA apklausose
Gerai

2023.11.22
Valerii Kosenko
Produkto savininkas „Saa Pet Project SDTest®“

1993 m. Valerii buvo kvalifikuotas kaip socialinis pedagogo-psichologas ir nuo to laiko pritaikė savo žinias projektų valdyme.
2013 m. Valerii įgijo magistro laipsnį ir projekto bei programų vadovo kvalifikaciją. Vykdydamas magistro programą, jis susipažino su projekto planu (GPM Deutsche Gesellschaft Für Projektmanagement e. V.) ir „Spiral Dynamics“.
Valerii ėmėsi įvairių „Spiral Dynamics“ testų ir panaudojo savo žinias bei patirtį, kad pritaikytų dabartinę SDTEST versiją.
Valerii yra autorius tyrinėti V.U.C.A. Koncepcija naudojant spiralinę dinamiką ir matematinę statistiką psichologijoje, daugiau nei 20 tarptautinių apklausų.
Šis įrašas turi 0 Komentarai
Atsakinėti į
Atšaukti atsakymą
Palikite savo komentarą
×
Rasite klaidą
SIŪLYTI SAVO Teisingas versija
Įveskite savo e-mail kaip norim
Siųsti
atšaukti
Redirect to your region's domain sdtest.us ?
YES
NO
Bot
sdtest
1
Sveiki! Leiskite paklausti tavęs, ar jūs jau susipažinote su spiralės dinamika?