ujian berasaskan buku «Spiral Dynamics:
Mastering Values, Leadership, and
Change» (ISBN-13: 978-1405133562)
Penaja

The Tale of the Tall Oak

Once upon a time, there was a tiny oak tree sapling named Peety. Peety dreamed of growing up into a mighty oak tree. 


Each year, Peety grew a little bit taller. He stretched his branches toward the sun and felt his trunk thicken as he grew. 


Over many years, Peety grew from a sapling into a young tree and finally into a tall, mature oak! He was so tall that he could see over the whole forest.


Peety noticed that the other tall oak trees had thick trunks, too. His friend Paul reached high into the sky just like Peety. Paul's trunk was thick and sturdy at the base. 


The small saplings that were sprouting had skinny little trunks. But Peety knew that would change over time as they grew taller.


Peety realized that, just like him, the taller an oak tree was, the thicker its trunk became. 


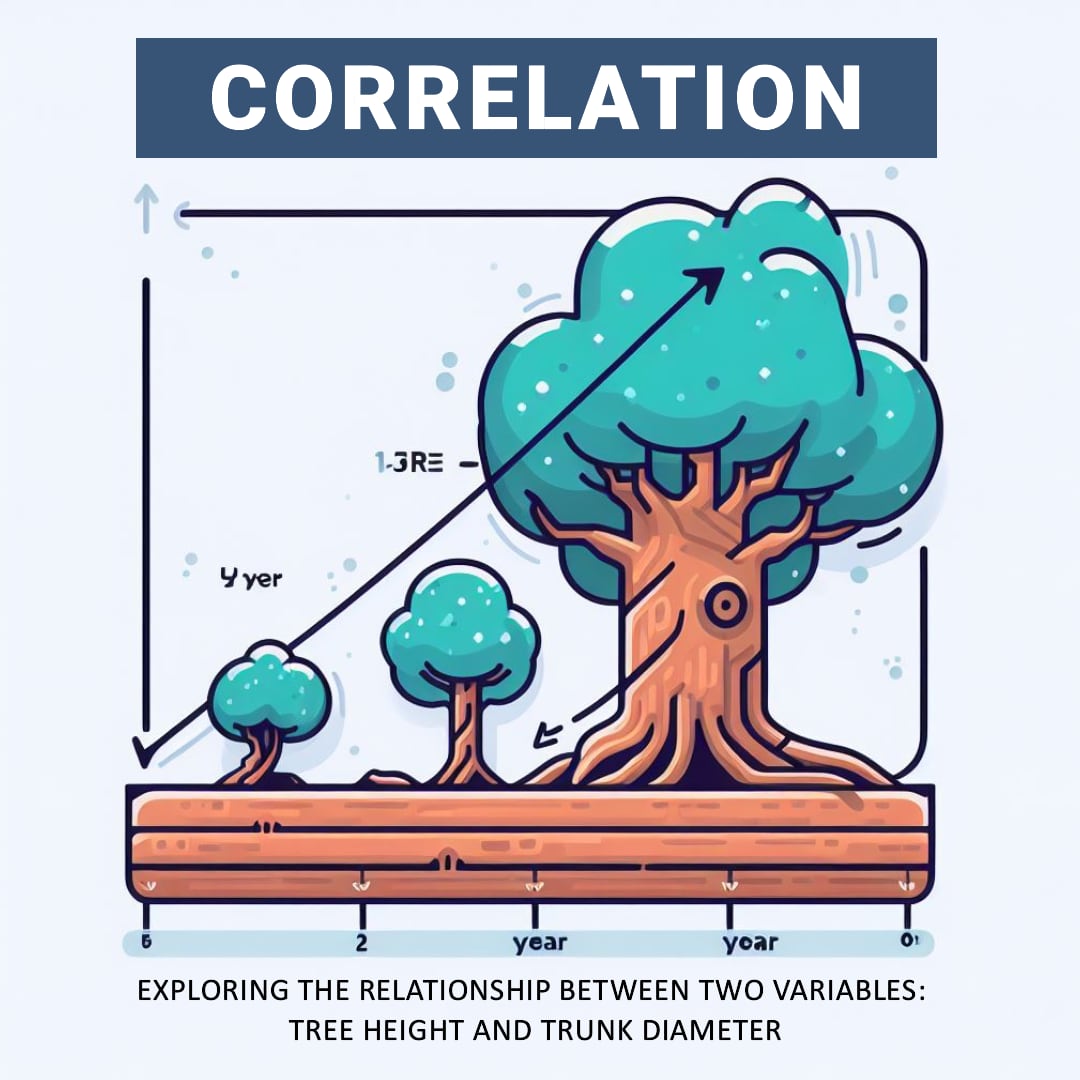
So even though the forest was filled with all different sizes of oak trees, Peety noticed a pattern - a correlation between tree height and trunk width. The tall trees always had thicker trunks, while the small saplings had skinny trunks. This was how pine trees grew strong enough to reach great heights! 


If you record how a tree grows - its height and trunk thickness - and plot it on a picture or graph, then the correlation is when these two things change together. That is, if you see that one is increasing, the other is also increasing, and vice versa.


The SDTEST® gives clues to someone's motivational values. However, additional polls can provide more pieces of the puzzle.


Imagine also giving a "Fears" poll. It asks people to rate different fears from 0 (not scary) to 5 (very scary). 


Now imagine 100 people who took both tests. You could match up each person's SDTEST® colors with their rated fears.


If people high in Blue values feared uncertainty more, that insight ties values to perceptions. Blue people may resist change more.


Or if Orange achievers feared failure most, that reveals their drive. They may overwork to avoid mistakes.


Comparing tests gives an expanded picture of values in action. More puzzle pieces make the whole image more apparent!


Multiple tests can work together, like colors blending on a palette. Other polls reveal what engages your values, like how your hobbies show what activities you enjoy most. Combined, they paint a richer picture of what motivates our thoughts and deeds.


Below you can read an abridged version of the results of our VUCA poll “Fears“. The full results of our VUCA poll “Fears“ are available for free in the FAQ section after login or registration.


Ketakutan

negara
bahasa
-
Mail
Mengira semula
Terdapat hubungan yang signifikan secara statistik
Pengagihan Normal, oleh William Sealy Gosset (Pelajar) r = 3.53
Pengedaran tidak normal, oleh Spearman r = 0.14
Soalan pengundian
Semua soalan
Semua soalan
Ketakutan terbesar saya adalah
Pengedaran
Korelasi positif,% Korelasi negatif,%
Biasa
-14.6
Answer 1
-8.9
Answer 2
-1.3
Answer 3
-8.8
Answer 4
-16.2
Answer 5
-2.8
Answer 6
-4.7
Answer 7
-12.9
Answer 8
-17.3
Answer 9
-12.8
Answer 10
-11.7
Answer 11
-14.5
Answer 12
-15.4
Answer 13
-11
Answer 14
-11.2
Answer 15
-7
Answer 16
Biasa
7.6
Answer 3
1
Answer 4
8
Answer 6
5.8
Answer 7
1.2
Answer 8
2.8
Answer 11
3.3
Answer 12
2
Answer 13
1.4
Answer 15
2.1
Answer 16
-1.1
Answer 1
-1.3
Answer 5
-5.4
Answer 9
-1.7
Answer 10
-0.3
Answer 14
Biasa
3.6
Answer 1
4
Answer 2
5
Answer 3
3.3
Answer 4
0.2
Answer 5
1.5
Answer 6
3.8
Answer 7
2.9
Answer 8
3.4
Answer 10
1.7
Answer 11
2.6
Answer 12
4.3
Answer 13
7.2
Answer 16
-1.5
Answer 9
-1.1
Answer 14
-1.2
Answer 15
Biasa
8.6
Answer 1
6.6
Answer 2
1.1
Answer 4
6.5
Answer 5
1.2
Answer 8
7.7
Answer 9
2.5
Answer 10
0.2
Answer 11
3.3
Answer 12
2.2
Answer 13
1.6
Answer 15
-5.6
Answer 3
-1.1
Answer 6
-3.2
Answer 7
-0.7
Answer 14
-5.2
Answer 16
Biasa
1.4
Answer 5
1.2
Answer 9
0.9
Answer 11
1.5
Answer 14
-1.1
Answer 1
-3.4
Answer 2
-3.9
Answer 3
-0.2
Answer 4
-5.5
Answer 6
-5.1
Answer 7
-2.4
Answer 8
-1.6
Answer 10
-3
Answer 12
-3.9
Answer 13
-3.6
Answer 15
-2.8
Answer 16
Tidak
normal
2.3
Answer 1
0.1
Answer 2
2.2
Answer 4
11.7
Answer 5
3.4
Answer 7
7.4
Answer 8
15.1
Answer 9
6.6
Answer 10
4.4
Answer 11
9.4
Answer 12
9.6
Answer 13
10.1
Answer 14
12.4
Answer 15
1.8
Answer 16
-2
Answer 3
Biasa
4.1
Answer 1
2
Answer 2
0.4
Answer 3
3.7
Answer 4
1.4
Answer 5
0.4
Answer 6
2
Answer 7
7.1
Answer 8
5.8
Answer 9
7.2
Answer 10
5.4
Answer 11
2.8
Answer 12
5.9
Answer 13
6.7
Answer 14
5.9
Answer 15
6.5
Answer 16


Eksport ke MS Excel
Fungsi ini akan tersedia dalam pemilihan VUCA anda sendiri
Okey

2023.11.22
Valerii Kosenko
Pemilik Produk SaaS Pet Project SDTest®

Valerii layak sebagai ahli pedagogi sosial-psikologi pada tahun 1993 dan sejak itu telah menggunakan pengetahuannya dalam pengurusan projek.
Valerii memperoleh ijazah sarjana dan kelayakan pengurus projek dan program pada tahun 2013. Semasa program tuannya, beliau menjadi akrab dengan Roadmap Project (GPM Deutsche Gesellschaft für Projektmanagement e. V.) dan Spiral Dynamics.
Valerii mengambil pelbagai ujian dinamik lingkaran dan menggunakan pengetahuan dan pengalamannya untuk menyesuaikan versi semasa SDTest.
Valerii adalah pengarang meneroka ketidakpastian V.U.C.A. Konsep menggunakan dinamik lingkaran dan statistik matematik dalam psikologi, lebih daripada 20 pemilihan antarabangsa.
Jawatan ini mempunyai 0 Komen
Balas kepada
Batalkan jawapan
Tinggalkan komen anda
×
ANDA MENCARI AN ERROR
CADANGAN VERSION BETUL ANDA
Masukkan e-mel anda seperti yang dikehendaki
Hantar
Batal
Redirect to your region's domain sdtest.us ?
YES
NO
Bot
sdtest
1
Hai! Izinkan saya bertanya kepada anda, adakah anda sudah biasa dengan dinamik lingkaran?