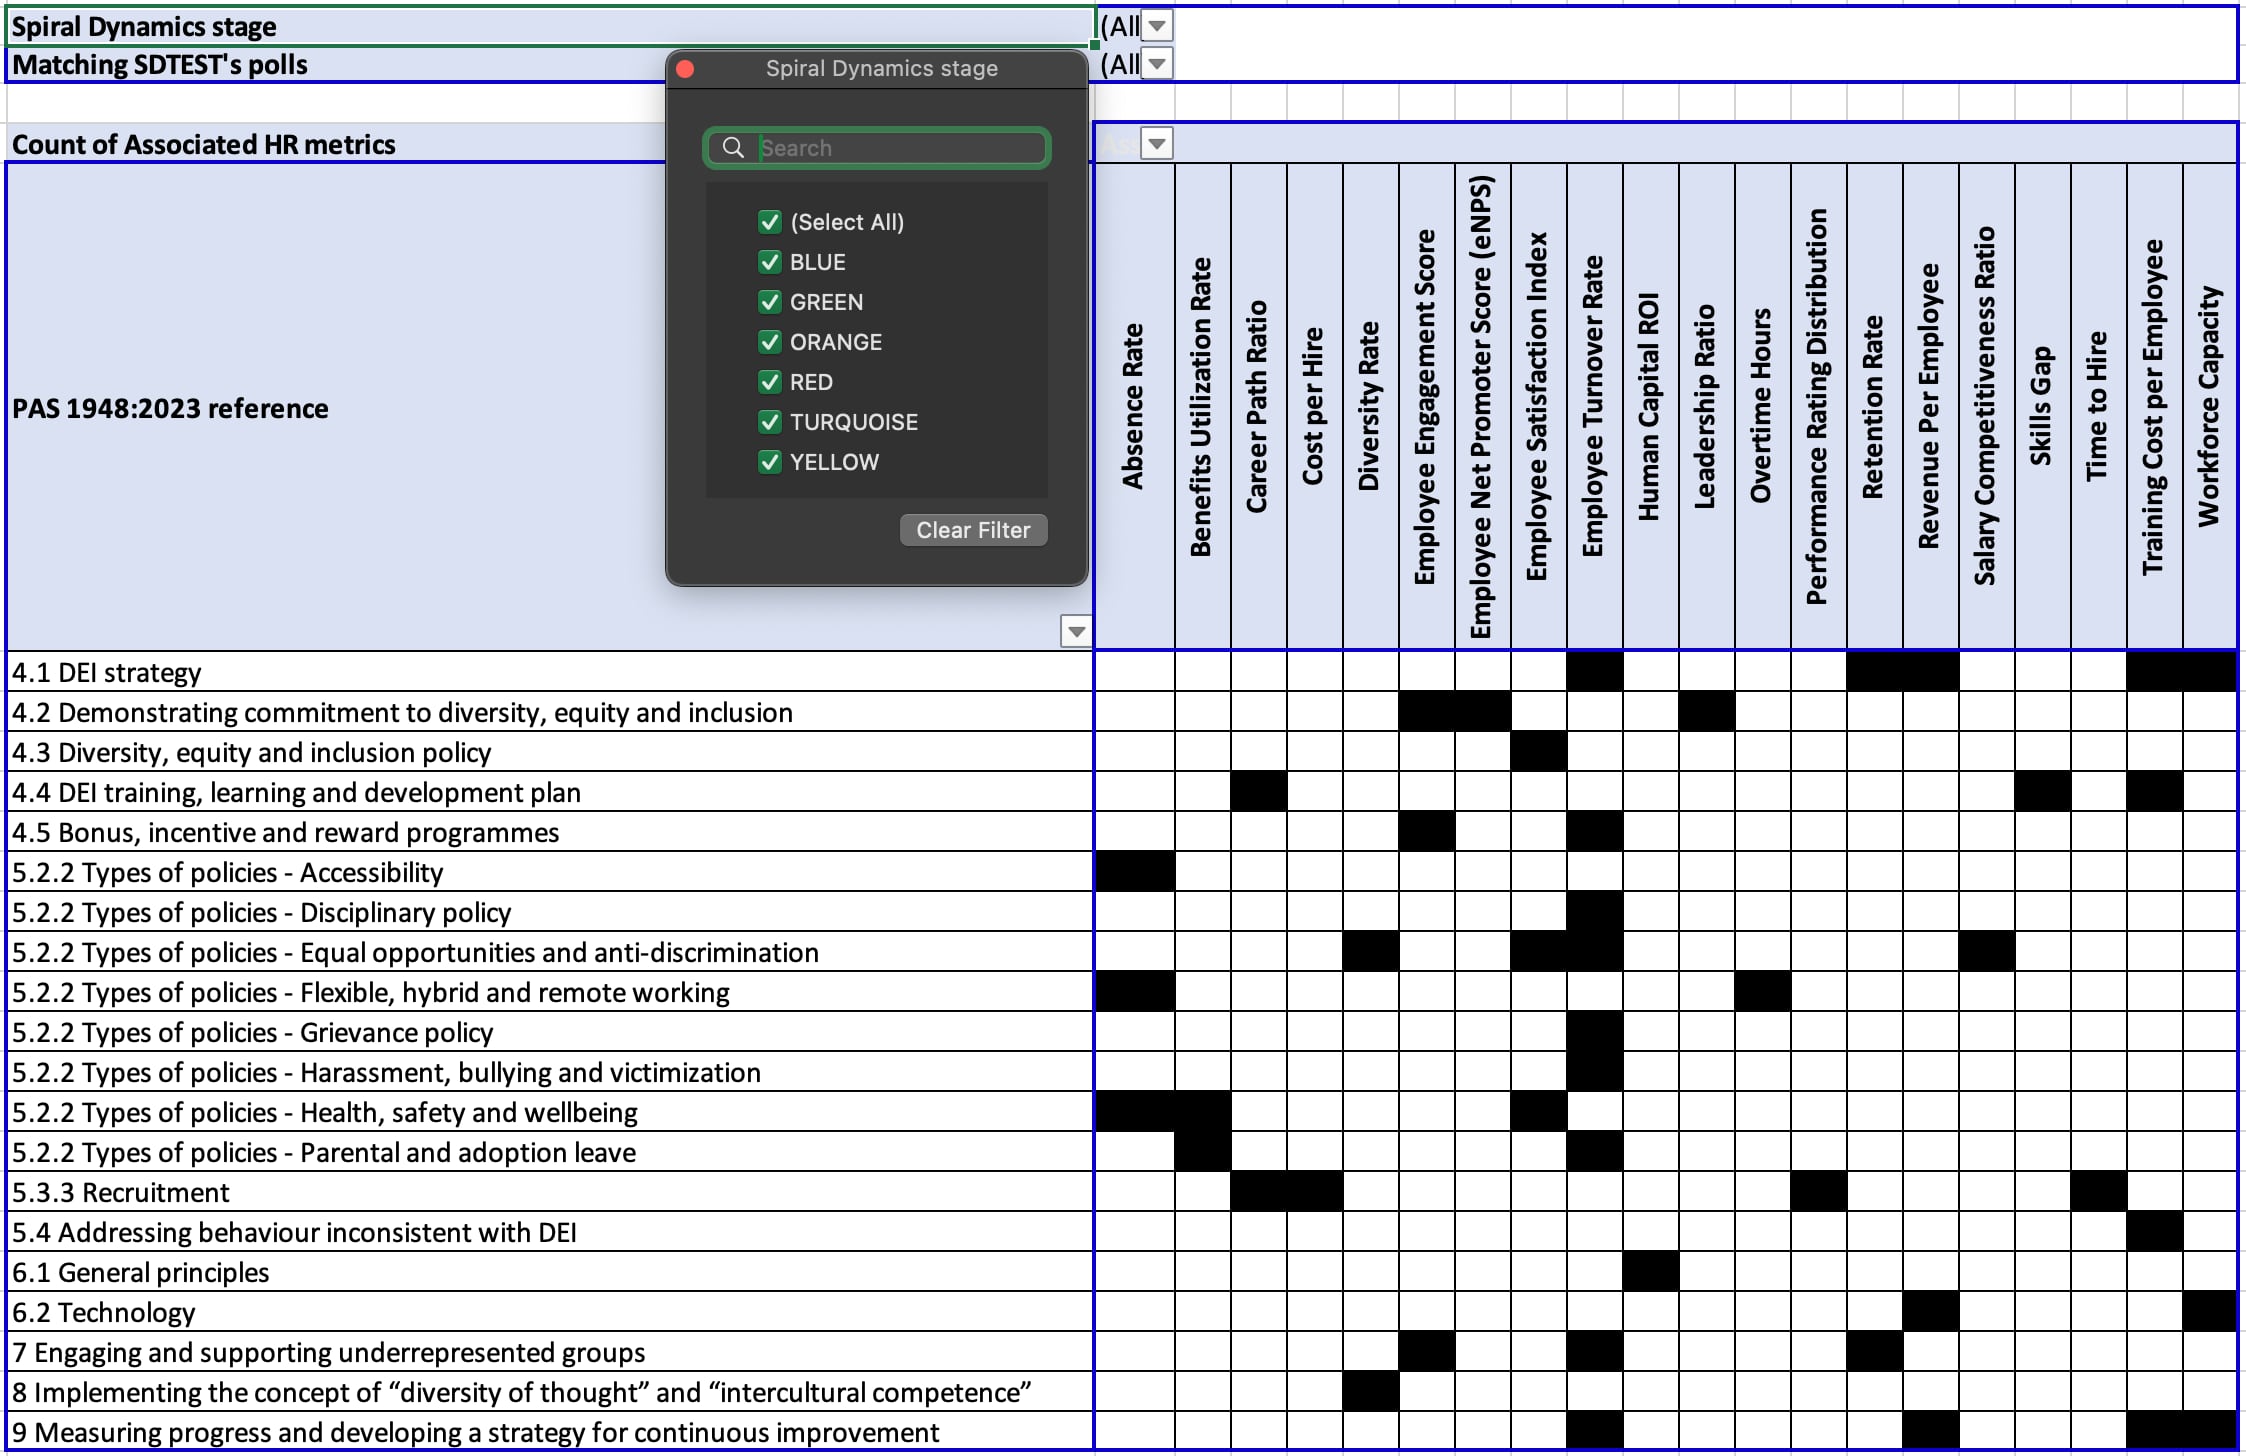
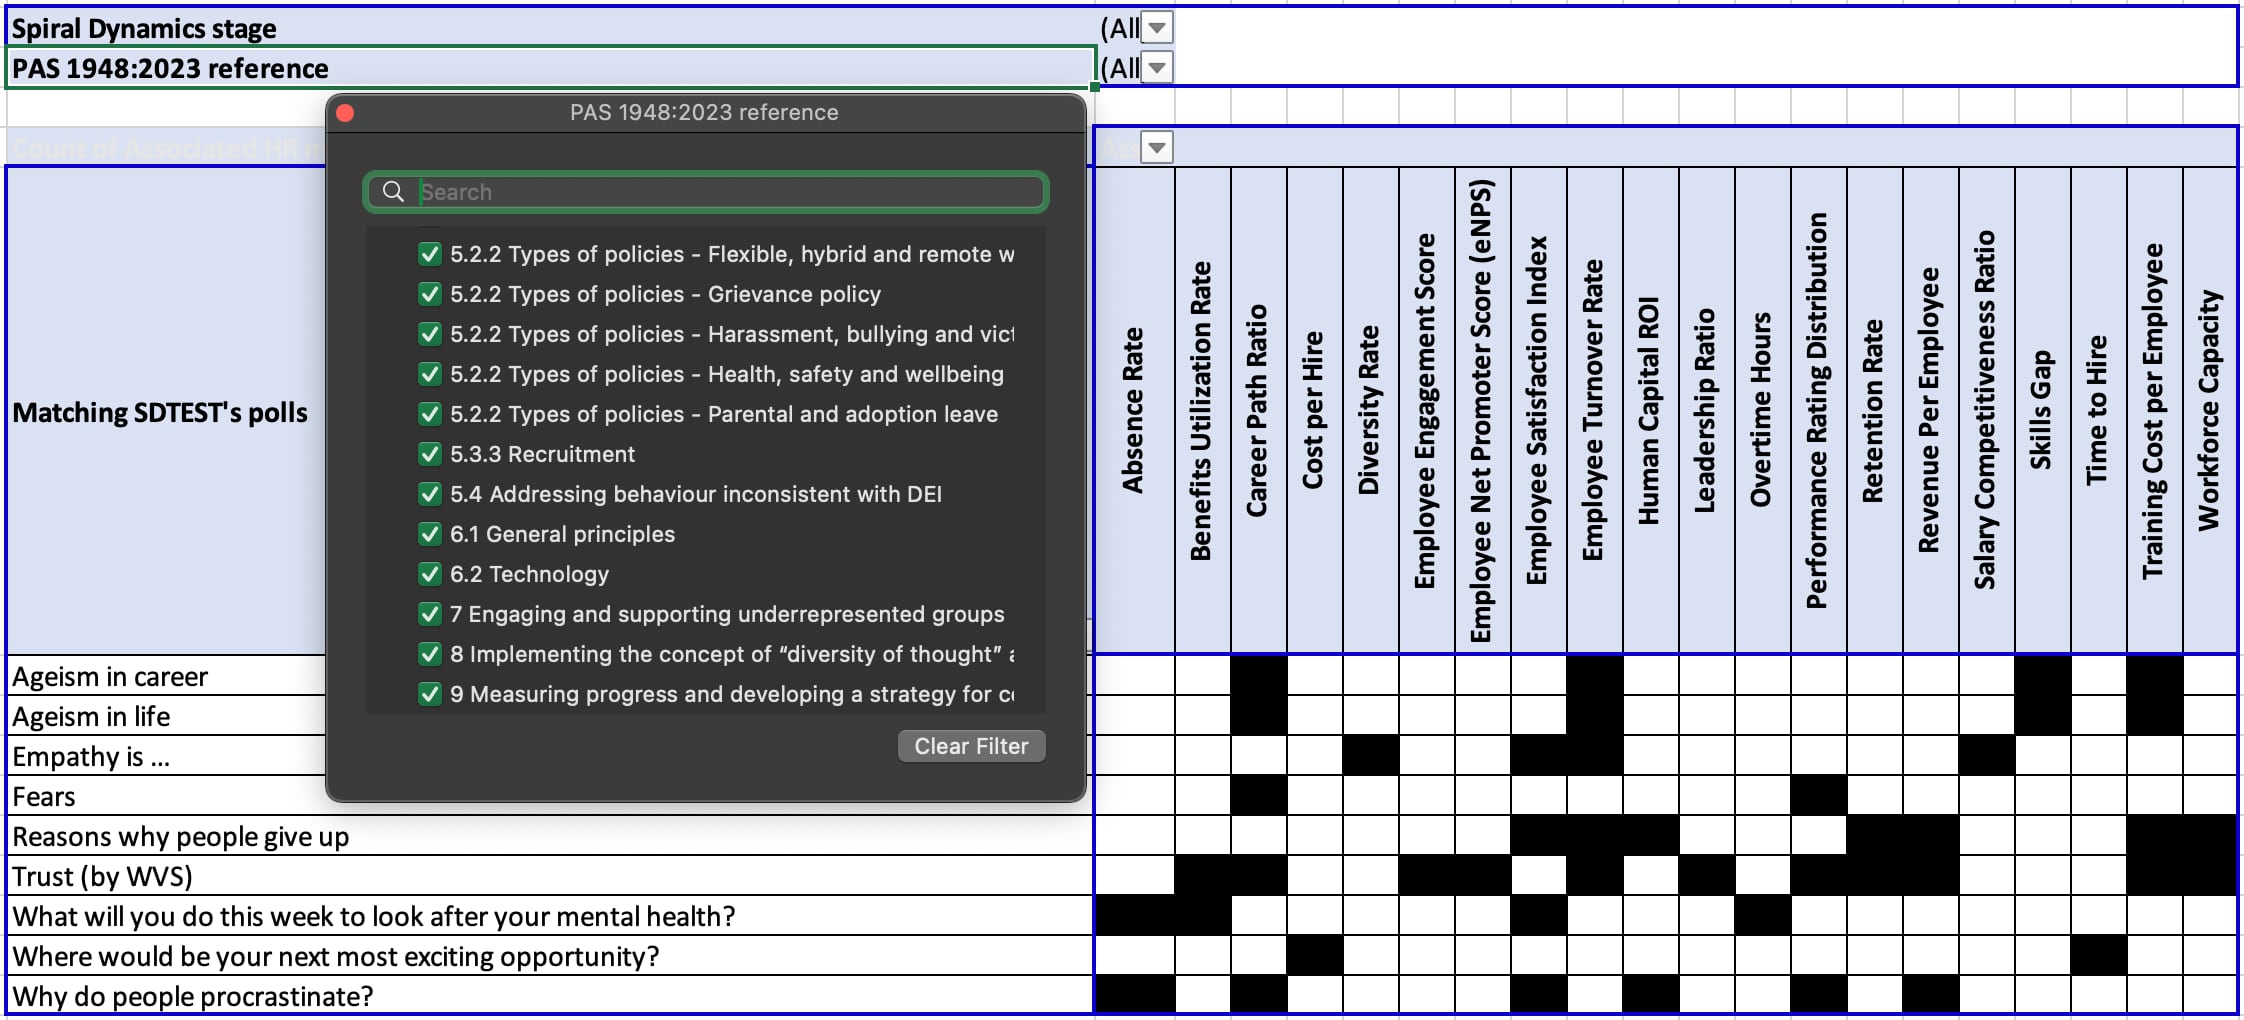
book ການທົດສອບຕາມ «Spiral Dynamics:
Mastering Values, Leadership, and
Change» (ISBN-13: 978-1405133562)
ຜູ້ສະຫນັບສະຫນູນ

Leveraging Standards, HR Metrics, and Spiral Dynamics to Advance Diversity, Equity, and Inclusion

Diversity, equity, and inclusion (DEI) have become crucial components of a healthy and productive workplace. A wealth of research demonstrates that organisations actively cultivating DEI are more likely to attract and retain top talent, foster innovation, and achieve better business outcomes. Studies show that diverse teams outperform homogeneous ones, and companies ranking highest in DEI significantly outperform their competitors.  


The British Standards Institution (BSI) has developed Standard PAS 1948:2023 – Diversity, equity, and inclusion in the workplace to support organisations pursuing inclusive excellence. Code of practice. This standard provides comprehensive guidance on creating frameworks to encourage, promote, and support DEI across all aspects of an organization. 


In addition to PAS 1948, this article will examine the relationships between the Spiral Dynamics model, commonly used human resources (HR) metrics, and the SDTEST® polls. Spiral Dynamics provides a framework for understanding how people and organisations evolve in their mindsets and values. HR metrics track indicators like turnover, cost per hire, and revenue per employee. SDTEST® polls give insights into psychological factors impacting workplace behaviours and relationships.  


By exploring the connections between these components, organisations can strengthen their DEI strategies with an evidence-based, measurement-driven approach grounded in behavioural science. This article will reveal linkages between PAS 1948’s guidance, stages of the Spiral Dynamics model, HR metrics, and SDTEST® polls. It will provide practical insights and recommendations for HR professionals seeking to optimise their DEI initiatives for greater recruiting, retention, innovation, and financial performance.


The goal is to demonstrate how implementing PAS 1948’s advice can be quantified through established HR metrics and supplemented by SDTEST®’s organisational culture and relationships assessments. A multi-lens perspective combining standards, theory, data, and psychological instruments allows organisations to make measurable progress on the continual journey toward diversity, equity, and inclusion.


Standard PAS 1948:2023 and Spiral Dynamics theory 


PAS 1948:2023 is a code of practice published by the British Standards Institution that guides organisations seeking to develop and implement a framework for encouraging, promoting, and supporting diversity, equity and inclusion in the workplace. 


Some of the key sections related to DEI are:

  • Section 4 - Implementing an effective DEI strategy and framework, including demonstrating leadership commitment, and having supportive policies, training, and measurement.
  • Section 5 - Recommendations for policies, processes, and practices that promote DEI, such as equal opportunities, anti-discrimination, accessibility, remote working, and grievance policies. 
  • Section 6 - Assessing the impact of DEI on organisational performance, including technology development and product design.
  • Section 7 - Guidance on engaging and supporting underrepresented groups.
  • Section 8 - Implementing concepts like "diversity of thought" and "intercultural competence."
  • Section 9 - Measuring progress and developing a continuous improvement strategy for DEI.


The standard provides practical tools and recommendations applicable to organisations of any size, description, or location. It emphasizes the growing importance of DEI for innovation, ethical business practices, talent recruitment, engagement, reputation, and overall performance.


By following PAS 1948, organisations can benchmark their current DEI practices, identify areas for improvement, and develop an effective strategy and plan of action tailored to their specific needs and objectives. It is a valuable resource for progressing on the DEI journey.


What is the theory of Spiral Dynamics?

Spiral Dynamics is a model of the evolution of individuals and societies' value systems (memes). Each has its code and color with a unique set of value orientations and priorities that form its beliefs and values. People and societies dynamically move through these levels depending on the changing conditions of life, experience, and challenges that stand in their way.


What color are you Spiral Dynamics?


ColorBeigePurpleRedBlueOrangeGreenYellowTurquoise
In a lifeSurvivalFamily relationsThe rule of forceThe power of truthCompetitionInterpersonal relationsFlexible streamThe Global vision
In a businessOwn farmFamily businessStarting up a personal businessBusiness Process ManagementProject managementSocial networksWin-Win-Win behaviorSynthesis

The beige value system represents human development's most basic and instinctual level. It is characterized by a focus on survival and physical needs and a lack of self-awareness or ability to reflect on one's actions. This value system is associated with pre-human and early human societies and is considered the most primitive of the eight value systems in the Spiral Dynamics model. It is seen as an undifferentiated, reactive stage of human development and is primarily concerned with meeting basic survival needs.

The purple value system represents a focus on tradition and spirituality and a belief in the supernatural. It is characterized by a strong sense of community and a belief in an influential, all-knowing leader or god. According to the Spiral Dynamics model, this value system is often associated with traditional agricultural societies and is considered the second level of human development. People in purple vMeme are guided by myths, rituals, and taboos and have a strong sense of belonging to a group. In addition, they have a strong sense of identity and are guided by the laws and beliefs of their ancestors.

The red value system focuses on power, self-expression, and individualism in Spiral Dynamics. It is characterized by a strong sense of self, impulsiveness, and a desire for immediate gratification. According to the Spiral Dynamics model, this value system is often associated with warrior cultures and is considered the third level of human development. People in red vMeme are driven by their impulses and desires, tend to be self-centered, focus on their own needs, and are often seen as dominant, assertive, and competitive. They have little concern for rules or laws and are willing to use force to achieve their goals. They tend to be impulsive and act on their desires without considering the consequences.

The blue value system focuses on order, rules, and tradition. It is characterized by a strong sense of duty and discipline and a belief in a moral code that is handed down from a higher authority. According to the Spiral Dynamics model, this value system is often associated with traditional, religious, or military societies and is considered the fourth level of human development. People in blue vMeme are guided by strict codes of conduct, and they are conformist; they tend to be rule-bound and follow a strict hierarchy. They tend to be loyal to their group or organization and have a strong sense of duty and responsibility. They strongly believe in a moral code or laws handed down by a higher authority and tend to be very traditional, conservative, and religious. They have a strong sense of right and wrong and tend to be judgmental of others who do not conform to their beliefs.

The orange value system focuses on reason, science, and technology. It is characterized by a focus on achieving goals and objectives through using rational, logical thinking and applying scientific methods. According to the Spiral Dynamics model, this value system is often associated with modern industrial societies and is considered the fifth level of human development. People in orange vMeme tend to be ambitious and goal-oriented; they value progress, efficiency, and results. They tend to be rational, logical, and analytical in their thinking and problem-solving. They are driven by a desire for knowledge and understanding and use scientific and technological methods to achieve their goals. They tend to be individualistic and competitive, valuing independence and self-reliance. They have little regard for tradition and are skeptical of spiritual or religious beliefs.

The green value system represents a focus on community and ecology, as well as a concern for the well-being of all. It is characterized by a holistic, systems-thinking approach and values such as unity, cooperation, and sustainability. This value system is often associated with post-modern and post-industrial societies. It is considered to be the most advanced of the eight value systems in the Spiral Dynamics model.

The next value system after green is the "yellow" or "integral" value system. This system represents the ability to integrate and transcend the previous systems and is characterized by the ability to see multiple perspectives, a focus on personal growth and development, and an understanding of complex systems. It is considered the most challenging and advanced value system and is associated with a holistic, integrative approach to understanding the world.

The turquoise value system represents a holistic, integrated, and ecological perspective. A focus on the interconnectedness of all things and recognizing the interdependence of human and natural systems characterizes it. According to the Spiral Dynamics model, this value system is often associated with post-modern and post-industrial societies and is considered the sixth level of human development. People in turquoise vMeme tend to be holistic and integrative, recognizing the interconnectedness of all things and valuing diversity, tolerance, and inclusiveness. They tend to be concerned with the well-being of both people and the planet and are driven by a desire for sustainability and harmony with the natural world. They tend to be spiritual but not religious and have a deep connection to nature and the more expansive universe. They have a strong sense of compassion and empathy and tend to be actively engaged in social and environmental causes.


Here is a table analysing the relationships between PAS 1948:2023 and Spiral Dynamics

#PAS 1948:2023 referenceSpiral Dynamics stage
Argumentation
(of the connection between PAS 1948:2023 and associated Spiral Dynamics stage)
1 4.1 DEI strategyGREENThe focus on diversity, equity, and inclusion aligns with the GREEN stage's emphasis on egalitarianism, community, and valuing diversity. The strategy aims to create a more inclusive and equitable workplace.
2 4.2 Demonstrating commitment to diversity, equity and inclusionYELLOWThe commitment to diversity, equity, and inclusion aligns with the YELLOW stage's focus on systemic thinking, collaboration, and valuing diversity. The commitment to DEI is a reflection of the organisation's values and vision for a more equitable and inclusive workplace.
3 4.3 Diversity, equity and inclusion policyBLUEThe focus on policies and procedures aligns with the BLUE stage's emphasis on order, structure, and following rules. The policy provides a framework for ensuring equity and inclusion in the workplace.
4 4.4 DEI training, learning and development planORANGEThe focus on training and development aligns with the ORANGE stage's emphasis on innovation, growth, and continuous improvement. The plan aims to improve employees' knowledge and skills related to DEI.
5 4.5 Bonus, incentive and reward programmesRED / ORANGEThe focus on bonuses, incentives, and rewards aligns with the RED stage's emphasis on power, achievement, and competition (ORANGE). The programs aim to motivate employees to achieve specific goals related to DEI.
6 5.2.2 Types of policies - Equal opportunities and anti-discriminationBLUEThe focus on policies and procedures aligns with the BLUE stage's emphasis on order, structure, and following rules. The policies aim to ensure equal opportunities and prevent discrimination in the workplace.
7 5.2.2 Types of policies - AccessibilityGREENThe focus on accessibility aligns with the GREEN stage's emphasis on egalitarianism, community, and valuing diversity. The policies aim to create a more inclusive and accessible workplace.
8 5.2.2 Types of policies - Harassment, bullying and victimisationBLUEThe focus on policies and procedures align with the BLUE stage's emphasis on order, structure, and following rules.
9 5.2.2 Types of policies - Grievance policyBLUEThe focus on policies and procedures aligns with the BLUE stage's emphasis on order, structure, and following rules. The policy provides a framework for addressing disciplinary issues in the workplace.
10 5.2.2 Types of policies - Disciplinary policyBLUEThe focus on policies and procedures aligns with the BLUE stage's emphasis on order, structure, and following rules. The policy provides a framework for addressing disciplinary issues in the workplace.
11 5.2.2 Types of policies - Flexible, hybrid and remote workingYELLOWThe focus on flexible, hybrid, and remote working policies aligns with the YELLOW stage's emphasis on learning, growth, and systemic thinking. The policies aim to address work-life balance and provide flexibility, which can improve employee well-being and reduce absenteeism.
12 5.2.2 Types of policies - Parental and adoption leaveGREENThe focus on parental and adoption leave policies aligns with the GREEN stage's emphasis on human bonding, community, and egalitarianism. The policies aim to support employees' family needs and promote work-life balance, which can improve employee well-being and reduce absenteeism. The policies also promote equity and inclusivity by supporting employees with family responsibilities.
13 5.2.2 Types of policies - Health, safety and wellbeingTURQUOISEThe focus on health, safety, and well-being policies aligns with the TURQUOISE stage's emphasis on holistic thinking, systemic awareness, and concern for the well-being of all. The policies aim to promote employee well-being and reduce absenteeism by supporting physical and mental health, safety, and wellness.
14 5.3.3 RecruitmentORANGEThe focus on recruitment practices aligns with the ORANGE stage's emphasis on achievement, success, and strategic thinking. The practices aim to attract and retain top talent, which can improve organisational performance and success.
15 5.4 Addressing behavior inconsistent with DEIGREENThe focus on addressing behavior inconsistent with DEI aligns with the GREEN stage's emphasis on human bonding, community, and egalitarianism. The approach aims to promote equity and inclusivity by addressing unwanted behaviors that create barriers to belonging and well-being.
16 6.1 General principlesYELLOWThe emphasis on principles in this section aligns with the YELLOW stage's emphasis on systemic thinking, learning, and growth. The principles aim to provide a foundation for DEI strategy and implementation.
17 6.2 TechnologyYELLOWThe focus on technology aligns with the YELLOW stage's emphasis on holistic thinking, systemic awareness, and concern for the well-being of all. The approach aims to leverage technology to promote equity, inclusivity, and well-being.
18 7 Engaging and supporting underrepresented groupsGREENThe focus on engaging and supporting underrepresented groups aligns with the GREEN stage's emphasis on egalitarianism, community, and valuing diversity. The initiative aims to create a more inclusive and equitable workplace.
19 8 Implementing the concept of “diversity of thought” and “intercultural competence”TURQUOISEThe focus on implementing diversity of thought and intercultural competence aligns with the TURQUOISE stage's emphasis on holistic thinking, global perspectives, and interconnectivity. The initiative aims to create a more inclusive and equitable workplace by valuing diverse perspectives and promoting cultural competence.
20 9 Measuring progress and developing a strategy for continuous improvementYELLOWThe focus on measuring progress and developing a strategy for continuous improvement aligns with the YELLOW stage's emphasis on learning, growth, and systemic thinking. The strategy aims to improve employee turnover, training investment, revenue, and capacity.


HR metrics and PAS 1948:2023 


Human resources (HR) metrics are essential for tracking workforce indicators that impact organisational goals and objectives. By analysing the relationships between standard HR metrics and the recommendations in PAS 1948:2023, organisations can gain valuable insights into how implementing the standard can influence key workforce factors.


This analysis examines 20 prominent HR metrics and identifies the relevant sections of PAS 1948:2023 that correlate to each metric. For example, metrics like employee turnover rate and training cost connect to aspects of the standard, such as DEI strategy, policies, and training plans. Meanwhile, recruitment practices relate to time and cost per hire. 


By reviewing these connections, organisations can better understand how targeted DEI initiatives prescribed by PAS 1948:2023 may potentially affect outcomes captured in their HR metrics. This can help shape data-driven and strategic DEI planning aligned with organisational priorities and objectives.


The following analysis will outline the key relationships between the HR metrics and corresponding sections of PAS 1948:2023. Understanding these potential impacts can strengthen DEI strategies and underscore the business case for diversity, equity, and inclusion.


Here is a table analysing the relationships between 20 HR metrics and PAS 1948:2023

#HR metricsPAS 1948:2023 reference
PAS 1948:2023 Text Explanation
1Employee Turnover Rate 4.1 DEI strategy
 4.5 Bonus, incentive and reward programmes
 5.2.2 Types of policies - Equal opportunities and anti-discrimination
 5.2.2 Types of policies - Harassment, bullying and victimisation
 5.2.2 Types of policies - Grievance policy
 5.2.2 Types of policies - Disciplinary policy
 5.2.2 Types of policies - Parental and adoption leave
 7 Engaging and supporting underrepresented groups
 9 Measuring progress and developing a strategy for continuous improvement
These sections reference turnover related to DEI strategy, policies on harassment/grievances, supporting underrepresented groups, and measurement.
2Cost per Hire 5.3.3 RecruitmentThis section covers recruitment practices
3Time to Hire 5.3.3 RecruitmentThis section covers recruitment practices
4Employee Engagement Score 4.2 Demonstrating commitment to diversity, equity and inclusion
 4.5 Bonus, incentive and reward programmes
 7 Engaging and supporting underrepresented groups
These sections relate to demonstrating DEI commitment, and engagement initiatives.
5Training Cost per Employee 4.1 DEI strategy
 4.4 DEI training, learning and development plan
 5.4 Addressing behavior inconsistent with DEI
 9 Measuring progress and developing a strategy for continuous improvement
References training in strategy, learning plans, addressing behaviors, and measurement.
6Absence Rate 5.2.2 Accessibility
 5.2.2 Flexible, hybrid and remote working
 5.2.2 Health, safety and wellbeing
These policy sections cover accessibility, flexible work, and health/wellbeing.
7Employee Net Promoter Score (eNPS) 4.2 Demonstrating commitment to diversity, equity and inclusionRelates to demonstrating DEI commitment.
8Performance Rating Distribution 5.3.3 RecruitmentLinks to recruitment practices.
9Diversity Rate 5.2.2 Equal opportunities and anti-discrimination
 8 Implementing the concept of “diversity of thought” and “intercultural competence”
References diversity in policy and thought/competence sections.
10Retention Rate 4.1 DEI strategy
 7 Engaging and supporting underrepresented groups
Relates to strategy and supporting underrepresented groups.
11Revenue Per Employee 4.1 DEI strategy
 6.2 Technology
 9 Measuring progress and developing a strategy for continuous improvement
References strategy, technology impact, and measurement.
12Employee Satisfaction Index 4.3 Diversity, equity and inclusion policy
 5.2.2 Equal opportunities and anti-discrimination
 5.2.2 Health, safety and wellbeing
Links to DEI policy and related policies.
13Leadership Ratio 4.2 Demonstrating commitment to diversity, equity and inclusionRelates to diversity in leadership.
14Skills Gap 4.4 DEI training, learning and development planCovers training to address skills gaps.
15Overtime Hours 5.2.2 Flexible, hybrid and remote workingRelated to flexible work policy.
16Salary Competitiveness Ratio 5.2.2 Equal opportunities and anti-discriminationHaving equitable, non-discriminatory policies could improve salary competitiveness.
17Benefits Utilisation Rate 5.2.2 Parental and adoption leave
 5.2.2 Health, safety and wellbeing
Policies on leave and wellbeing relate to benefits.
18Career Path Ratio 4.4 DEI training, learning and development plan
 5.3.3 Recruitment
Training and recruitment practices could impact career path ratios.
19Human Capital ROI 6.1 General principlesAssessing DEI impact on performance relates to human capital ROI.
20Workforce Capacity 4.1 DEI strategy
 6.2 Technology
 9 Measuring progress and developing a strategy for continuous improvement
Mentions capacity in strategy, technology, and measurement sections.


Here is a table analysing the relationships between Standard PAS 1948:2023 and 20 HR metrics

#PAS 1948:2023 referenceAssociated HR metrics
Explanatory Summary
14.1 DEI strategyEmployee Turnover Rate, Training Cost per Employee, Revenue Per Employee, Workforce Capacity, Retention RateDEI strategy impacts turnover, training needs, revenue, capacity, and retention.
24.2 Demonstrating commitment to diversity, equity and inclusionEmployee Engagement Score, Employee Net Promoter Score (eNPS), Leadership RatioCommitment affects engagement, recommendation willingness, and leadership representation.
34.3 Diversity, equity and inclusion policyEmployee Satisfaction IndexPolicy provides a satisfaction framework.
44.4 DEI training, learning and development planTraining Cost per Employee, Skills Gap, Career Path RatioTraining addresses skills gaps impacting employee costs and advancement.
54.5 Bonus, incentive and reward programmesEmployee Turnover Rate, Employee Engagement ScoreRewards link to turnover and engagement.
65.2.2 Types of policies - Equal opportunities and anti-discriminationEmployee Satisfaction Index, Employee Turnover Rate, Diversity Rate, Salary Competitiveness RatioPolicies affect diversity, pay equity, satisfaction, and turnover.
75.2.2 Types of policies - AccessibilityAbsence RateAccessibility policy enables attendance.
85.2.2 Types of policies - Harassment, bullying and victimisationEmployee Turnover RatePolicy aims to improve environment and retention.
95.2.2 Types of policies - Grievance policyEmployee Turnover RatePolicy provides recourse affecting retention.
105.2.2 Types of policies - Disciplinary policyEmployee Turnover RatePolicy establishes conduct standards influencing retention.
115.2.2 Types of policies - Flexible, hybrid and remote workingAbsence Rate, Overtime HoursRemote work policy impacts absence and overtime.
125.2.2 Types of policies - Parental and adoption leaveEmployee Turnover Rate, Benefits Utilisation RateLeave policy offers benefits influencing turnover.
135.2.2 Types of policies - Health, safety and wellbeingAbsence Rate, Employee Satisfaction Index, Benefits Utilisation RateWellbeing policy improves health, satisfaction, benefits use, and attendance.
145.3.3 RecruitmentTime to Hire, Cost per Hire, Career Path Ratio, Performance Rating DistributionRecruiting connects to timescales, costs, advancement, performance, and hire quality.
155.4 Addressing behavior inconsistent with DEITraining Cost per EmployeeAddressing behaviors affects training costs.
166.1 General principlesHuman Capital ROIPrinciples relate to overall people investments.
176.2 TechnologyRevenue Per Employee, Workforce CapacityTechnology impacts individual and workforce productivity.
187 Engaging and supporting underrepresented groupsEmployee Turnover Rate, Employee Engagement Score, Retention RateEngaging underrepresented groups influence turnover, engagement, and retention.
198 Implementing the concept of “diversity of thought” and “intercultural competence”Diversity RateConcepts link directly to diversity measurement.
209 Measuring progress and developing a strategy for continuous improvementEmployee Turnover Rate, Training Cost per Employee, Revenue Per Employee, Workforce CapacityMeasurement enables improvement across turnover, training, revenue, and capacity factors.


SDTEST® polls and PAS 1948:2023 / HR metrics 


The SDTEST® polls are tools designed to provide insights into various aspects of an organisation's culture, relationships, and employee experiences. They are particularly relevant to Diversity, Equity, and Inclusion (DEI) as they can help identify areas of strength and areas that need improvement in these domains.


The SDTEST® polls cover various topics, including trust within the organisation, reasons why people give up, perceptions of ageism, and empathy. Each survey provides valuable data that can inform DEI strategies and initiatives.


For instance, the "ໄວ້ວາງໃຈ (#WVS)" poll shows how much employees trust leadership, coworkers, and the organisation overall. Higher trust suggests greater engagement and a lower likelihood of turnover among both majority and underrepresented groups. The trust data gives HR guidance on whether DEI initiatives effectively engage underrepresented groups. Improving trust in leadership and peers indicates engagement initiatives are effective for underrepresented groups. This trajectory should continue. Reduced trust suggests initiatives are missing the mark. Further effort is needed to understand and address unique needs.


Similarly, the "Reasons people give up" survey provides relevant insights into turnover causes that could inform improvement strategies. Fewer reasons to give up and increasing trust signify measurement provides valuable insights to guide improvement. Continued monitoring is recommended. More reasons to give up and declining trust imply measurement is not translating to meaningful actions. Evaluating metrics, analysis, and follow-through is needed.


The SDTEST® polls are also linked to various HR metrics, such as Employee Turnover Rate, Training Cost per Employee, Revenue Per Employee, and Workforce Capacity. These metrics can measure the impact of DEI strategies, policies, training, and measurement on employee turnover, engagement, satisfaction, absence rate, and cost per employee.


The SDTEST® polls provide a comprehensive tool for assessing and improving DEI within an organisation. They offer valuable insights into employees' experiences and perceptions, which can inform the development and implementation of effective DEI strategies and initiatives.


Including correlation values in the analysis is important for a few key reasons:

  1. Quantification - The numerical correlations provide quantitative evidence and measurability to support the connections between the Spiral Dynamics stages, SDTEST® polls, and HR metrics. This strengthens the arguments by grounding them in mathematical data points versus just theoretical assertions.
  2. Nuance - The correlation coefficients capture the relative strengths, directions, and nuances of the relationships between variables. A high positive or negative correlation indicates a more robust connection, while values closer to zero suggest weaker ties. This adds granular detail.
  3. Counterintuitive Insights - The correlations sometimes reveal counterintuitive relationships that go against logical assumptions, such as the negative correlation between Orange and sensing emotions. The data highlights less apparent linkages.
  4. Transparency - Sharing the actual correlation values allows readers to inspect the data themselves and make their own determinations about the merits of the arguments. This transparency lends more credibility.
  5. Context Specificity - The examples provide real-world context for interpreting what specific correlations mean in actionable terms for an organisation. This context gives meaning. 


In summary, the mathematical correlation values and samples provide critical quantification, nuance, unexpected insights, transparency, and practical contextual meaning to elevate the arguments beyond theoretical assertions to data-driven guidance tied directly to organisational initiatives and goals. The correlations transform conceptual relationships into measurable analytics. Read more about this in the article 16 Reasons People Give Up on Their Goals.


The analyses of the relationships between PAS 1948:2023, 20 HR metrics, Spiral Dynamics stages, and the SDTEST®'s polls.

#PAS 1948:2023 referenceAssociated HR metricsMatching SDTEST®'s pollsArguments for matching SDTEST®'s pollsHow to interpret a positive or negative change in the matching SDTEST®'s polls
14.1 DEI strategyEmployee Turnover Rate, Training Cost per Employee, Revenue Per Employee, Workforce Capacity, Retention Rateເຫດຜົນທີ່ຄົນເຮົາຍອມແພ້ (ໂດຍ Anna ທີ່ສໍາຄັນ)This poll includes options like:

*Stop believing in themselves
*Fear the future
*Resist change
*Feel the world owes them something

These psychological attributes connect to turnover rate, training needs, and capacity management.
A decrease in responses like "Stop believing in themselves" or "Fear the future" would indicate improved confidence in organizational DEI strategy and direction. This suggests the strategy is effectively engaging employees.

An increase in options like "Resist change" could signal issues in change management and communication around DEI initiatives. This warrants further analysis into resistance sources and mitigation.
24.2 Demonstrating commitment to diversity, equity and inclusionEmployee Engagement Score, Employee Net Promoter Score (eNPS), Leadership Ratioໄວ້ວາງໃຈ (#WVS)This poll asks about trust levels in various groups like family, neighborhood, people of other nationalities/religions, government, etc.

Higher trust levels indicate positive work relationships and company culture, contributing to employee engagement and willingness to recommend the employer. The data provides insights into the psychological and social dynamics that underpin engagement and loyalty.
Higher trust in leadership and the organisation would indicate employees perceive genuine commitment to DEI. This connects to higher engagement and willingness to recommend the employer.

Declining organisational trust would suggest that DEI commitment is not resonating. Further examination into trust deterrents and re-evaluating communication and demonstration of commitment.
34.3 Diversity, equity and inclusion policyEmployee Satisfaction Indexເຫດຜົນທີ່ຄົນເຮົາຍອມແພ້ (ໂດຍ Anna ທີ່ສໍາຄັນ),
ເປັນຫຍັງຜູ້ຄົນຈຶ່ງຊັກຊ້າ?
These polls include options like fear of failure and fear of poverty. If certain groups show a disproportionately high fear of failure, it could indicate biases or barriers facing those groups that reduce their satisfaction. The fear data provides insights into psychological factors impacting different demographics' workplace experience, which informs appropriate DEI policy responses.Reduction in disproportionate fear of failure by certain groups would indicate DEI policies are effectively addressing biases and barriers.

An increase in imbalanced fears between groups could signal policies are inadequate in providing equity. Additional analysis and policy enhancement is warranted.
44.4 DEI training, learning and development planTraining Cost per Employee, Skills Gap, Career Path RatioAgeism ໃນການເຮັດວຽກ,
ການເປັນຣະວັງໃນຊີວິດ
These polls provide data on whether employees feel they have personally experienced age-related biases or discrimination in work and life contexts. If specific demographics report higher perceived ageism, it indicates a potential need for targeted training and development on mitigating biases and improving inclusiveness.Decreasing perceptions of ageism would indicate DEI training initiatives effectively mitigate biases. This warrants continued investment in such programs.

An increase in ageism experiences for specific demographics would suggest current training needs re-evaluation and enhancement to be more inclusive.
54.5 Bonus, incentive and reward programmesEmployee Turnover Rate, Employee Engagement Scoreໄວ້ວາງໃຈ (#WVS),
ຄວາມເຫັນອົກເຫັນໃຈແມ່ນ ...
These polls give insights into company culture and relationships that impact turnover.Improved trust and empathy levels signal reward programs are implemented fairly and are cultivating an inclusive culture. This approach should be sustained.

Declining trust or empathy suggests rewards may not be perceived as equitable. Further analysis into distribution, criteria, and process transparency is merited.
65.2.2 Types of policies - Equal opportunities and anti-discriminationDiversity Rate, Salary Competitiveness Ratio, Employee Satisfaction Index, Employee Turnover Rateຄວາມເຫັນອົກເຫັນໃຈແມ່ນ ...This poll includes options about feeling, listening, understanding, and perspectives - but does not directly assess definitions or capabilities. The extent to which employees exhibit empathy on those survey dimensions could provide insights into organisational inclusivity and belonging, which can inform anti-discrimination policies.Improvement in measures like listening, understanding others' feelings, and seeing different perspectives indicates greater organisational inclusion. This suggests current policies enable conditions for belonging.

Declines in those measures imply potential barriers to equity and belonging. Further analysis alongside policy review is warranted to ensure anti-discrimination policies translate into inclusive behaviors.
75.2.2 Types of policies - AccessibilityAbsence Rateເປັນຫຍັງຜູ້ຄົນຈຶ່ງຊັກຊ້າ?If employees cite exhaustion as a reason for procrastination, it indicates they may be overworked or lacking support, which could lead to absences. The procrastination data provides insight into factors driving absence rate, which can inform accessibility policies that promote attendance.Reducing exhaustion-related procrastination suggests that current accessibility policies effectively support employee capacity and wellbeing. This approach should continue.

An increase in procrastination due to exhaustion implies accessibility gaps that warrant policy review. Further analysis into pain points, accommodations, and support needs is merited.
85.2.2 Types of policies - Harassment, bullying and victimisationEmployee Turnover RateAgeism ໃນການເຮັດວຽກ,
ການເປັນຣະວັງໃນຊີວິດ
These polls can shed light on harassment/bullying prevalence.Fewer perceived harassment and ageism experiences indicate policies are effectively curbing unwanted behaviors. Continued training and enforcement are worthwhile.

More reported harassment and ageism suggest current policies may not sufficiently prevent toxic behaviors. Further action is needed, potentially including stricter sanctions.
95.2.2 Types of policies - Grievance policyEmployee Turnover Rateເຫດຜົນທີ່ຄົນເຮົາຍອມແພ້ (ໂດຍ Anna ທີ່ສໍາຄັນ)The poll relates to improvement measurement and turnover causes.Declining tendencies to give up in the face of challenges demonstrates grievance policies provide recourse, restoring confidence. This enables employees to persist despite setbacks.

An increase in reasons people give up implies grievance resolution is inadequate. Reviewing reporting, investigation, and actions processes could reveal gaps to address.
105.2.2 Types of policies - Disciplinary policyEmployee Turnover Rateໄວ້ວາງໃຈ (#WVS)The poll gives insights into company culture and relationships that impact turnover.Increased trust in leadership indicates discipline is applied fairly, reinforcing confidence. This fosters an inclusive culture.

Declining leadership trust suggests inconsistency/bias in discipline. Reviewing policies for clarity, transparency, and equitable application is recommended.
115.2.2 Types of policies - Flexible, hybrid and remote workingOvertime Hours, Absence Rateທ່ານຈະເຮັດແນວໃດໃນອາທິດນີ້ເພື່ອເບິ່ງແຍງສຸຂະພາບຈິດຂອງທ່ານ?Flexible, hybrid, and remote working policies connect to the Absence Rate, as flexible policies can improve work-life balance and reduce absenteeism. The poll on mental health priorities provides insights into what employees feel helps their well-being and coping with work demands. If the top responses relate to connecting with others and practicing mindfulness, it suggests flexibility that would reduce absences. The mental health data gives HR guidance on the most impactful flexibilities.Growth in priorities like relationships and mindfulness implies flex arrangements enable effective coping. Providing flexibility to support these priorities should continue.

Fewer people citing those priorities could indicate arrangements are not meeting wellbeing needs. Examining potential enhancements around boundaries and isolation is worthwhile.
125.2.2 Types of policies - Parental and adoption leaveBenefits Utilisation Rate, Employee Turnover Rateໄວ້ວາງໃຈ (#WVS)The poll gives insights into company culture and relationships that impact turnover.Improving trust signals that leave policies are implemented fairly, promoting loyalty. This approach should continue to cultivate inclusion.

Reduced trust implies potential resentment over provisions. Ensuring equitable access and support across employees is recommended.
135.2.2 Types of policies - Health, safety and well-beingEmployee Satisfaction Index, Benefits Utilisation Rate, Absence Rateທ່ານຈະເຮັດແນວໃດໃນອາທິດນີ້ເພື່ອເບິ່ງແຍງສຸຂະພາບຈິດຂອງທ່ານ?Health, safety, and well-being policies also link to Absence Rate, as good health/wellness programs improve attendance. Again, the mental health poll shows what employees themselves feel supports their well-being and ability to be present and productive at work. If responses indicate a desire for physical activity, mindfulness, or other priorities, HR can design health policies and programs accordingly to minimise absences.An increasing selection of priorities like relationships, mindfulness, and activity suggests health policies effectively support wellbeing needs. This approach should continue.

Fewer people citing those priorities indicates health policies may not fully meet well-being expectations. Examining potential enhancements is recommended.
145.3.3 RecruitmentTime to Hire, Cost per Hireບ່ອນທີ່ທ່ານຈະເປັນໂອກາດທີ່ຫນ້າຕື່ນເຕັ້ນທີ່ສຸດຕໍ່ໄປຂອງທ່ານ?This poll provides insights into what opportunities appeal to top talent. If current openings don't align with excitement factors, it may prolong hiring timeframes and necessitate higher compensation to secure candidates. This data helps recruiters craft attractive job offerings to reduce the time and cost to hire.Increased match between current openings and excitement for startups/SMEs/market leaders indicates recruiting is attracting top talent efficiently.

A growing mismatch suggests tactics are becoming less compelling to talent's interests. Closer tracking of preferences is needed to realign recruiting.
155.3.3 RecruitmentPerformance Rating Distribution, Career Path Ratioໄວ້ວາງໃຈ (#WVS),
ເປັນຫຍັງຜູ້ຄົນຈຶ່ງຊັກຊ້າ?,
ຄວາມຢ້ານກົວ
These polls give functional perspectives on organisational dynamics relevant to recruitment and selection.
1) The ໄວ້ວາງໃຈ (#WVS) poll gives perspectives into how much employees trust leadership to recruit fairly and select high-quality candidates.
2) The ຄວາມຢ້ານກົວ or ເປັນຫຍັງຜູ້ຄົນຈຶ່ງຊັກຊ້າ? polls shed light on any biases or organisational weaknesses that impact hiring decisions.
Improving trust and reasons not to procrastinate or fear implies effective, aligned recruiting. This trajectory should continue.

Declines suggest potential process or selection issues. Further analysis into bottlenecks, biases, and behaviors would be beneficial.
165.4 Addressing behaviour inconsistent with DEITraining Cost per Employeeເຫດຜົນທີ່ຄົນເຮົາຍອມແພ້ (ໂດຍ Anna ທີ່ສໍາຄັນ)The options in this poll, like resisting change, believing in weaknesses, and fearing failure, provide insights into addressing inconsistent behaviors.An increase implies inadequate reporting or resolution of issues. Reviewing processes, accountability, and training is recommended.

Fewer reasons to give up, like resisting change or fearing failure, suggest addressing behaviors is effective. Employees are confident in speaking up.
176.1 General principlesHuman Capital ROIເຫດຜົນທີ່ຄົນເຮົາຍອມແພ້ (ໂດຍ Anna ທີ່ສໍາຄັນ)This poll provides insights into factors causing people to abandon goals or initiatives. Understanding key demotivators can inform organisational change management and help address behaviors hindering progress.An increase in reasons to give up implies change initiatives are not adequately motivating or supporting employees. Further analysis of pain points is recommended.

Fewer selected reasons to give up indicate organisational change initiatives effectively engage employees and foster persistence. This suggests good change management.
186.2 TechnologyRevenue Per Employee, Workforce Capacityໄວ້ວາງໃຈ (#WVS),
ເປັນຫຍັງຜູ້ຄົນຈຶ່ງຊັກຊ້າ?
These polls give relevant organisational culture and adaptability insights to inform effectively, employee-focused technology strategy and capability building.
1)The "ໄວ້ວາງໃຈ (#WVS)" poll gives insights into how much employees trust leadership to implement technology changes responsibly and inclusively.
2)The "ເປັນຫຍັງຜູ້ຄົນຈຶ່ງຊັກຊ້າ?" poll sheds light on any overwhelm, distraction, or analysis paralysis related to technology change.
Growing trust and less procrastination signal technology is implemented responsibly. A continued transparent, inclusive approach is recommended.

Declining trust and more procrastination suggest poor change management. Further analysis into communication, support, and empathy is needed.
197 Engaging and supporting underrepresented groupsEmployee Turnover Rate, Employee Engagement Score, Retention Rateໄວ້ວາງໃຈ (#WVS)This poll shows how much employees trust leadership, coworkers, and the organisation. Higher trust suggests greater engagement and a lower likelihood of turnover among both majority and underrepresented groups. The trust data guides HR on whether DEI initiatives effectively engage underrepresented groups specifically.Improving trust in leadership and peers indicates engagement initiatives are effective for underrepresented groups. This trajectory should continue.

Reduced trust suggests initiatives are missing the mark. Further effort is needed to understand and address unique needs.
208 Implementing the concept of “diversity of thought” and “intercultural competence”Diversity Rateຄວາມເຫັນອົກເຫັນໃຈແມ່ນ ...This poll assesses components of empathy. Higher empathy suggests greater inclusion and belonging. The data provides useful insights into organisational culture inclusiveness to inform diversity of thought initiatives.Growth in dimensions like understanding others' feelings and seeing different perspectives indicates increasing empathy and inclusion. This suggests that diversity of thought initiatives are effective. Those dimensions' decline implies potential barriers to belonging that diversity initiatives should address.
219 Measuring progress and developing a strategy for continuous improvementEmployee Turnover Rate, Workforce Capacity, Training Cost per Employee, Revenue Per Employeeເຫດຜົນທີ່ຄົນເຮົາຍອມແພ້ (ໂດຍ Anna ທີ່ສໍາຄັນ),
ໄວ້ວາງໃຈ (#WVS)
The poll "ເຫດຜົນທີ່ຄົນເຮົາຍອມແພ້ (ໂດຍ Anna ທີ່ສໍາຄັນ)" provides relevant insights into turnover causes that could inform improvement strategies. The "ໄວ້ວາງໃຈ (#WVS)" poll also gives perspectives into company culture and relationships that underpin the other metrics.Fewer reasons to give up and increasing trust signify measurement provides valuable insights to guide improvement. Continued monitoring is recommended.

More reasons to give up and declining trust imply measurement is not translating to meaningful actions. Evaluating metrics, analysis, and follow-through are needed.


The key relationships are:
  1. DEI strategy, policies, training, and measurement can impact employee turnover, engagement, satisfaction, absence rate, and cost per employee.
  2. Recruitment practices relate to time and cost to hire, performance distribution, and quality of hire.
  3. Technology adoption and workforce capacity optimisation can improve revenue per employee.
  4. Support for underrepresented groups connects to engagement and retention.
  5. Continuous improvement in DEI links back to turnover, training investment, revenue, and capacity.

So, in summary, many facets of the PAS 1948 DEI guidance connect to standard HR metrics around workforce stability, capability building, performance, and business impact. Adopting PAS 1948 recommendations can be quantified through HR metrics tracking.


Practical implications and recommendations 


The analysis in this article reveals several practical implications for HR professionals and organisations seeking to optimise their diversity, equity, and inclusion strategies:

  1. The linkages between PAS 1948's guidelines and common HR metrics like turnover, engagement, and training investment demonstrate that adopting the standard's recommendations can lead to measurable workforce improvements. Tracking these metrics over time provides a quantitative view of how well DEI initiatives work.
  2. Incorporating psychological and cultural models like Spiral Dynamics and SDTEST® assessments can supplement traditional metrics and provide additional context into The mindsets underpinning inclusion challenges and successes. This insight enables more targeted DEI interventions.
  3. Ongoing measurement and analysis of metrics, polls, and standards compliance is essential to continue driving positive change. Regular scorecards, audits, and progress reports will ensure the DEI strategy remains aligned with the organisation's goals as circumstances evolve.
  4. No single solution universally solves DEI needs. Maintaining an open, learning mindset and willingness to understand data-driven HR metrics and human behavioural dynamics are crucial. A blended approach is recommended.
  5. While this article focuses on PAS 1948, correlating standards, metrics, and psychological instruments could be applied to other inclusion frameworks and assessment tools to reveal additional relationships and opportunities.


Based on these implications, some recommended next steps for HR teams include:

  1. Map your current HR metrics to DEI standards like PAS 1948 to identify gaps and focus areas. Consider supplementing with culture/behavior assessments.
  2. Educate leaders and employees on how metrics trace to real business outcomes. Share examples of how improved turnover and engagement translate to tangible benefits.
  3. Implement regular progress reporting with consistent metrics tied to your DEI objectives. Analyse trends over time.
  4. Use audit findings to enhance policies, training, analytics, and communications around DEI.
  5. Continue researching emerging standards, assessment tools, and leading practices to strengthen your integrated DEI measurement approach.


Further research could examine the relationships between DEI frameworks, HR metrics, and assessments across different countries, industries, and types of organizations. As the workforce evolves, so too should evidence-based DEI strategies. Ongoing development of practical guidance resources like this article is key to driving inclusive excellence worldwide.


In addition to the analysis presented in this article, the relationships between PAS 1948, HR metrics, Spiral Dynamics, and SDTEST® polls were compiled into a database format. 


Organising the data into this structured database provides several benefits:

  1. The ability to analyse connections and trends across multiple dimensions. The data can be sliced by PAS 1948 section, metric, Spiral stage, or SDTEST® poll to uncover insights.
  2. Flexible filtering, grouping, and sorting to examine the data from different angles. For instance, looking at all metrics related to a certain PAS section.  
  3. Creation of interactive OLAP reports to visualise and interact with The multi-dimensional data. reports make it easy to spot patterns.
  4. A centralised repository for ongoing analysis as new metrics, polls, and standards emerge. The database provides a foundation.
  5. The capacity to handle large data sets if analysis expands to multiple countries, industries, or organisation types. Databases scale better than spreadsheets.
  6. The ability to connect and combine with other data sources, like HR information systems, if analysis to that depth is desired. 


The OLAP reports generated from the database provide user-friendly summaries accessible to HR teams without technical expertise. The reports turn the data into actionable insights.


This structured database opens up many possibilities for deeper analysis of the DEI measurement space. It creates a foundation for scalable, insightful reporting as organizations collect more benchmarking data over time. The visualisation and flexibility empower faster, more informed decision-making.


Further possibilities include connecting operational HR data to provide drill-down visibility into how DEI policies link to specific workplace outcomes in real-time. The database format created here helps enable that level of integrated analysis.


The example of the Database format

#PAS 1948:2023 referenceAssociated HR metricsSpiral Dynamics stageMatching SDTEST®'s polls
14.1 DEI strategyEmployee Turnover RateGREENເຫດຜົນທີ່ຄົນເຮົາຍອມແພ້ (ໂດຍ Anna ທີ່ສໍາຄັນ)
639 Measuring progress and developing a strategy for continuous improvementRevenue Per EmployeeYELLOWໄວ້ວາງໃຈ (#WVS)


The examples of OLAP reports based on the Database format


Leave a comment with a request for the database example in MS Excel with the examples of OLAP reports and we will send it to you at the specified email.


Conclusion 


This article revealed and analysed the relationships between Standard PAS 1948:2023, Spiral Dynamics theory, common HR metrics, and the SDTEST® polls. While diversity, equity, and inclusion are complex, useful insights emerge from examining these interconnected frameworks.


The key takeaways are that implementing the recommendations in PAS 1948 can positively influence many workforce metrics around stability, capability, performance, and business impact. Complementing the HR data with organisational culture and psychology assessments provides additional context to guide effective action. 


Ongoing measurement and improvement are crucial for realising the well-established benefits of DEI, from innovation and productivity to recruitment and reputation. The methodical, integrated approach outlined here aims to turn good intentions into measurable results.


Much work must be done to build truly inclusive workplaces that unlock everyone’s full potential. This journey requires commitment from business leaders, a learning mindset, and a collaborative spirit across organisations.


With enabling standards like PAS 1948, an ever-growing body of supporting research, and an array of assessment tools now available, organisations have more resources than ever to pursue inclusive excellence. 


The will to engage in this vital work with openness, persistence, and care for one another remains. Done right, diversity, equity, and inclusion benefits us all. By continuing to refine our understanding of this landscape, we create workplaces where everyone can thrive.


2023.11.15
Valerii Kosenko
ເຈົ້າຂອງຜະລິດຕະພັນ SAAS Pet Project SDTEST®

Valerii ມີຄຸນນະພາບທີ່ມີຄຸນນະພາບເປັນນັກຈິດຕະວິທະຍາ - ນັກຈິດຕະວິທະຍາໃນປີ 1993 ແລະໄດ້ນໍາໃຊ້ຄວາມຮູ້ຂອງລາວໃນການຄຸ້ມຄອງໂຄງການ.
Valerii ໄດ້ຮັບປະລິນຍາໂທແລະໂຄງການຂອງໂຄງການແລະໂຄງການຈັດການໃນປີ 2013. ໃນລະຫວ່າງປີ 2013.
Valerii ໄດ້ທົດສອບແບບເຄື່ອນໄຫວແບບເຄື່ອນໄຫວແບບເຄື່ອນໄຫວຕ່າງໆແລະໃຊ້ຄວາມຮູ້ແລະປະສົບການຂອງລາວເພື່ອປັບຕົວເຂົ້າກັບ SDTEST ຂອງ SDTES ຂອງລາວໃນປະຈຸບັນ.
Valerii ແມ່ນຜູ້ຂຽນຂອງການສໍາຫຼວດຄວາມບໍ່ແນ່ນອນຂອງ V.U.C.A.A. Concept ໂດຍໃຊ້ແບບເຄື່ອນໄຫວແບບເຄື່ອນໄຫວແລະສະຖິຕິທາງຄະນິດສາດໃນດ້ານຈິດຕະສາດ, ການສໍາຫຼວດສາກົນຫຼາຍກວ່າ 20 ປີ.
ໂພສນີ້ມີ 0 ຄໍາເຫັນ
ຕອບ​ກັບ
ຍົກເລີກການຕອບ
ອອກຄໍາເຫັນຂອງທ່ານ
×
ທ່ານຫາ AN ERROR
ສະເຫນີຮຸ່ນທີ່ຖືກຕ້ອງຂອງທ່ານ
ກະລຸນາໃສ່ອີເມວຂອງທ່ານເປັນທີ່ຕ້ອງການ
ສົ່ງ
ຍົກເລີກການ
Redirect to your region's domain sdtest.us ?
YES
NO
Bot
sdtest
1
ສະ​ບາຍ​ດີ! ຂ້າພະເຈົ້າຂໍຖາມທ່ານ, ທ່ານຄຸ້ນເຄີຍກັບແບບເຄື່ອນໄຫວແບບເຄື່ອນໄຫວແລ້ວບໍ?